TI Indicators Sentinel
- September 8, 2022
- 10:38 am
Working with a lot of customers I have had a big number of questions about how to automate the purging process of stale TI indicators from Sentinel. There is a way to do it manually, but if you have thousands of them, it will be a tough task to remove only one hundred at a time. I decided to automate this process and started investigating different kinds of automation (Graph API, PowerShell, etc.).
After some investigation, the API command that allows to get a list of all indicators stored in Microsoft tenant was found. This one: GET https://graph.microsoft.com/beta/security/tiIndicators. And I decided to build a Logic App that will get all TI indicators, extract their IDs and then remove each of them by running DELETE https://graph.microsoft.com/beta/security/tiIndicators/{id}. Unfortunately, when I was testing it, I stuck with the situation when I was getting nothing even though I have more than one thousand indicators in my test environment.
Trying to search on forums, asking questions I got no answers and decided to open a case for Microsoft Support. I really appreciate Microsoft Support team for providing me a professional and fast response and explanation. Now, I will try to explain a little bit how the TI backend works on Microsoft. Let’s move to the technical part.
1. TI indicators ingestion
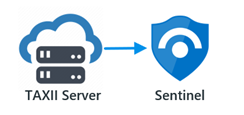
There are a few ways to ingest TI indicators. The first one is to use a built-in TAXII connector. There are a plenty of them. You can use, for example, Anomali, IBM X-Force, Pulsedive, and other. The configuration is simple, based on Microsoft you only need to get the TAXII server API Root and Collection ID, and then enable the Threat Intelligence – TAXII data connector in Microsoft Sentinel.

The second way is to build a playbook that will pull TI indicators from a TI provider and push them into Sentinel Using Graph Security API. There is a great playbook for pulling TI indicators from Alien Vault: Azure-Sentinel/Playbooks/Get-AlienVault_OTX at master · Azure/Azure-Sentinel (github.com)

Such kinds of playbooks require minor configuration and can be deployed from GitHub.
The third way for adding TI indicator is flat file import. This feature is currently in Private Preview and will be available soon for Public. Sentinel administrator will be able to import indicators from a csv of json file.
And the last way is manual creation. This is a good option only if you have a few indicators to add and have no time to write scripts and build automation.
One more important thing to mention is the fact that Graph Security API serves Threat Intelligence by TenantID and AppID (the application ID that uploads the TI through GSA and was configured in Azure AD). If the TI indicators were uploaded using one application (AppID) and then queried with another application (AppID), the data will not be returned. For example, if you use the playbook mentioned above, you should Register an application in your Azure AD to ingest indicators. Then you will not be able to query those indicators with another application, for example, with Microsoft Graph Explorer. You must use the same application to get the list of indicators you uploaded.
2. TI indicators storing
Based on Microsoft, when using the tiIndicators entity, you must specify the Microsoft security solution you want to utilize the indicators for via the targetProduct property and define the action (allow, block, or alert) to which the security solution should apply the indicators via the action property.
In the playbook for puling indicators from GitHub we have the following parameter: “targetProduct” that should be “Azure Sentinel”. Yes, Azure and not Microsoft Sentinel. By setting this parameter, we configure the playbook to ingest logs into Sentinel Log Analytics Workspace and so we will be able to process the ingested indicators later. In Logs under Microsoft Sentinel a new table is created “ThreatIntelligenceIndicator”.

This is our final diagram for Microsoft Sentinel:

3. TI indicators pulling
As well as for ingesting indicators, there are a few ways for pulling them from Microsoft backend and from Log Analytics Workspace. It was mentioned previously that to pull indicators from Microsoft Graph backend you should use Microsoft Security Graph API with the same Application and Tenant ID. Otherwise you will get nothing. You should also pay attention to the expiration date of the ingested certificates. If you try to get a specific indicator(s) and get nothing, probably it has been expired and remove from Graph backend. Use this resource Graph Explorer | Try Microsoft Graph APIs – Microsoft Graph to test the API.

Pulling TI indicators from Sentinel Log Analytics Workspace is simpler. You need to open a Sentinel LAW and get them by running a KQL query. For example, this one:
ThreatIntelligenceIndicator
| project TimeGenerated, Description, IndicatorId
| top 100 by IndicatorId
This KQL will show you the first 100 indicators by IndicatorID. Don’t forget to set a date under “Time range”.
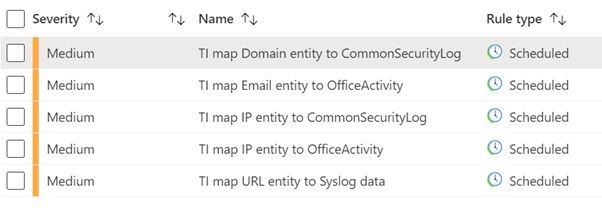
You can also use built-in queries to protect your environment or build you own queries based on your company requirements.

Summary
Microsoft’s security ecosystem has a huge number of capabilities that help organizations to protect their environments from modern security threats. And TI indicators is only one piece of puzzle called Threat Intelligence. It is important to understand how this feature works to gain the best results from it.
I hope the information provided in this article will be helpful for community and will allow to understand how the Microsoft TI works better.
If you have any questions or suggestions for the text, I will be glad to hear them Mikhail@aztek.co.il
There is an amazing webinar Threat Intelligence published by Microsoft Team: Cyber Threat Intelligence Demystified in Microsoft Sentinel – YouTube